How to Analyze Stocks Before Buying (Beginner Friendly Guide 2026)
Alex on 27 February, 2026 | No Comments


How to Analyze Stocks Before Buying (Beginner Friendly Guide)
Buying a stock without analyzing it is like driving blindfolded. Many beginners invest based on social media hype, YouTube tips, or friend recommendations — and end up losing money.
If you want to succeed in the stock market, you must understand how to analyze stocks properly before investing your hard-earned money.
In this beginner-friendly guide, you will learn:
- What stock analysis really means
- Fundamental analysis step-by-step
- Technical analysis basics
- Important financial ratios
- How to check company health
- A simple stock analysis checklist
Let’s start from the basics.
📊 What Does It Mean to Analyze a Stock?
Stock analysis means evaluating a company to determine whether its stock is worth buying, holding, or avoiding.
There are two main types of stock analysis:
- Fundamental Analysis
- Technical Analysis
Smart investors often use both together.
🏢 Step 1: Understand the Company (Business First)
Before looking at charts or numbers, ask:
- What does the company do?
- How does it make money?
- Is the business model sustainable?
- Does it have competitors?
For example, if you analyze Apple Inc., you’ll see:
- It sells iPhones, MacBooks, services
- Strong global brand
- Loyal customer base
- Recurring revenue from services
Understanding the business helps you decide if the company has long-term potential.
📈 Step 2: Fundamental Analysis (Company Financial Health)
Fundamental analysis focuses on financial data and company performance.
🔹 A. Revenue Growth
Check if revenue is increasing year by year.
- Growing revenue = business expansion
- Falling revenue = potential problem
Consistent growth is a positive sign.
🔹 B. Net Profit
Revenue is good — but profit is more important.
Ask:
- Is the company actually making money?
- Is profit increasing?
A company with rising profits is usually financially healthy.
🔹 C. Earnings Per Share (EPS)
EPS shows how much profit the company makes per share.
Higher EPS = better profitability.
🔹 D. Price-to-Earnings Ratio (P/E Ratio)
Formula:
Price per Share ÷ Earnings per Share
- High P/E → Stock may be overvalued
- Low P/E → Stock may be undervalued
But always compare P/E with competitors in the same industry.
🔹 E. Debt Level
Too much debt can be dangerous.
Check:
- Debt-to-Equity Ratio
- Interest coverage
Companies with manageable debt are safer investments.
📊 Step 3: Technical Analysis (Price & Chart Study)
Technical analysis studies price movements and patterns.
Here’s what beginners should focus on:
📉 A. Trend Direction
Ask:
- Is the stock in an uptrend?
- Is it in a downtrend?
- Is it moving sideways?
Golden Rule:
📌 “Never fight the trend.”
📊 B. Support and Resistance
- Support = Price level where stock stops falling
- Resistance = Price level where stock stops rising
Buying near support reduces risk.
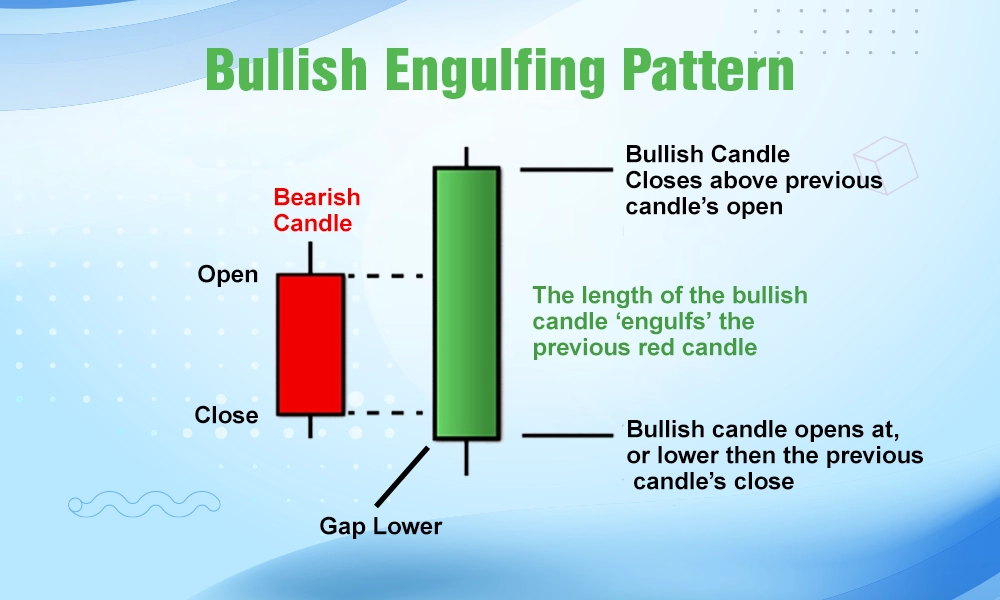
🕯 C. Candlestick Patterns
Candlestick charts show price behavior.
Common beginner patterns:
- Bullish engulfing
- Hammer
- Doji
These patterns help identify potential reversals.
📉 Example Chart Visualization

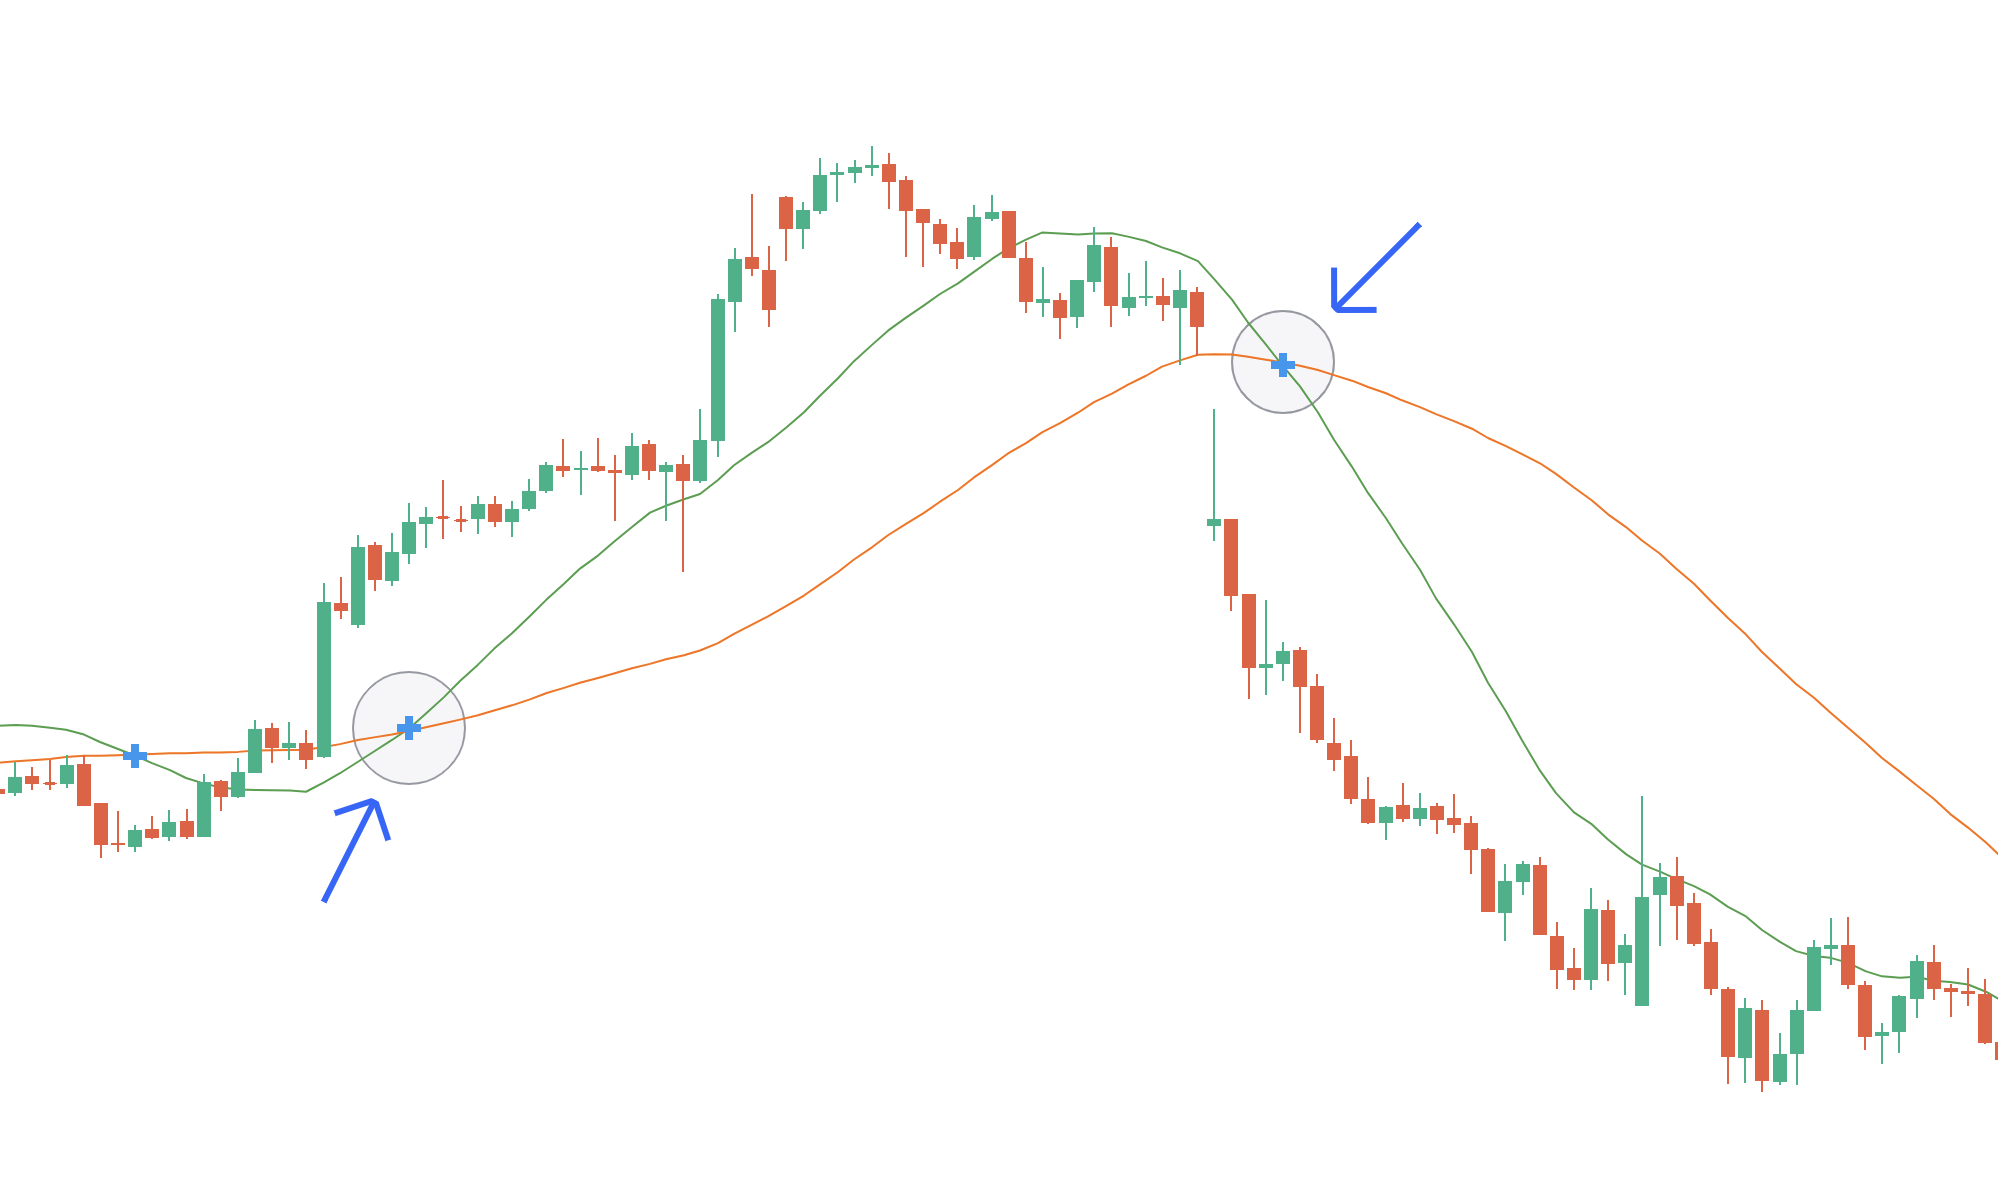
4
🧠 Step 4: Check Industry & Market Conditions
Even a good company can struggle in a bad industry.
Ask:
- Is the sector growing?
- Is the economy strong?
- Are interest rates rising?
- Is inflation high?
For example, tech stocks may perform differently depending on economic cycles.
📅 Step 5: Look at Recent News & Earnings
Check:
- Recent earnings report
- Management changes
- Lawsuits
- New product launches
Quarterly earnings often cause big price movements.
🛡 Step 6: Risk Management Before Buying
Before clicking “Buy”, ask yourself:
- What is my stop loss?
- What is my target?
- How much of my capital am I risking?
Never risk more than 1–2% of your account on one trade.
📝 Simple Stock Analysis Checklist (For Beginners)
Before buying any stock, confirm:
✔ Company revenue is growing
✔ Profits are increasing
✔ Debt is manageable
✔ Industry outlook is positive
✔ Chart shows uptrend
✔ Entry is near support
✔ Risk is calculated
If 5–6 conditions are met → It may be a good opportunity.
⚠ Common Mistakes Beginners Make
- Buying based on hype
- Ignoring financial reports
- Not setting stop loss
- Investing all money in one stock
- Following social media tips blindly
Avoid these mistakes if you want long-term success.
📊 Long-Term Investing vs Short-Term Trading
If you are:
Long-Term Investor:
Focus more on fundamentals.
Short-Term Trader:
Focus more on technical analysis.
Best approach?
👉 Combine both.
💡 Practical Example (Simple Breakdown)
Let’s imagine:
- Company revenue growing 15% yearly
- EPS increasing
- Low debt
- Strong industry
- Stock in uptrend
- Pullback near support
This is a structured buying opportunity — not emotional trading.
🚀 Final Thoughts
Analyzing stocks before buying is not complicated — but it requires discipline.
Remember:
- Study the business
- Check financial health
- Analyze the chart
- Understand risk
- Avoid emotional decisions
The stock market rewards patient, informed investors — not gamblers.
If you follow this guide consistently, you’ll reduce mistakes and improve your investing confidence.
❓ FAQs
Q1: Can beginners analyze stocks?
Yes. Start with basic fundamental and technical analysis.
Q2: Is technical analysis enough?
No. Combining both methods is safer.
Q3: How long should I analyze before buying?
Spend at least a few hours reviewing financial data and charts.
⚠ Disclaimer
This article is for educational purposes only. We are not financial advisors. Investing in the stock market involves risk. Always do your own research before investing.