Best TradingView Indicators for Day Trading in 2026 (Top 7 Tools for Accurate Entries & Exits)
Alex on 25 February, 2026 | No Comments
Best TradingView Indicators for Day Trading in 2026
Day trading is not about prediction. It’s about probability, timing, and risk control. The charts move fast. Emotions move faster. Indicators, when used properly, act like measurement tools — not crystal balls.
In 2026, more traders than ever are using TradingView because it offers advanced charting, community-built indicators, and powerful customization.
But here’s the truth:
Most beginners overload their charts with 10 indicators and still lose money.
The goal is not more indicators.
The goal is the right combination.
Let’s break down the best TradingView indicators for day trading this year — and how to use them intelligently.
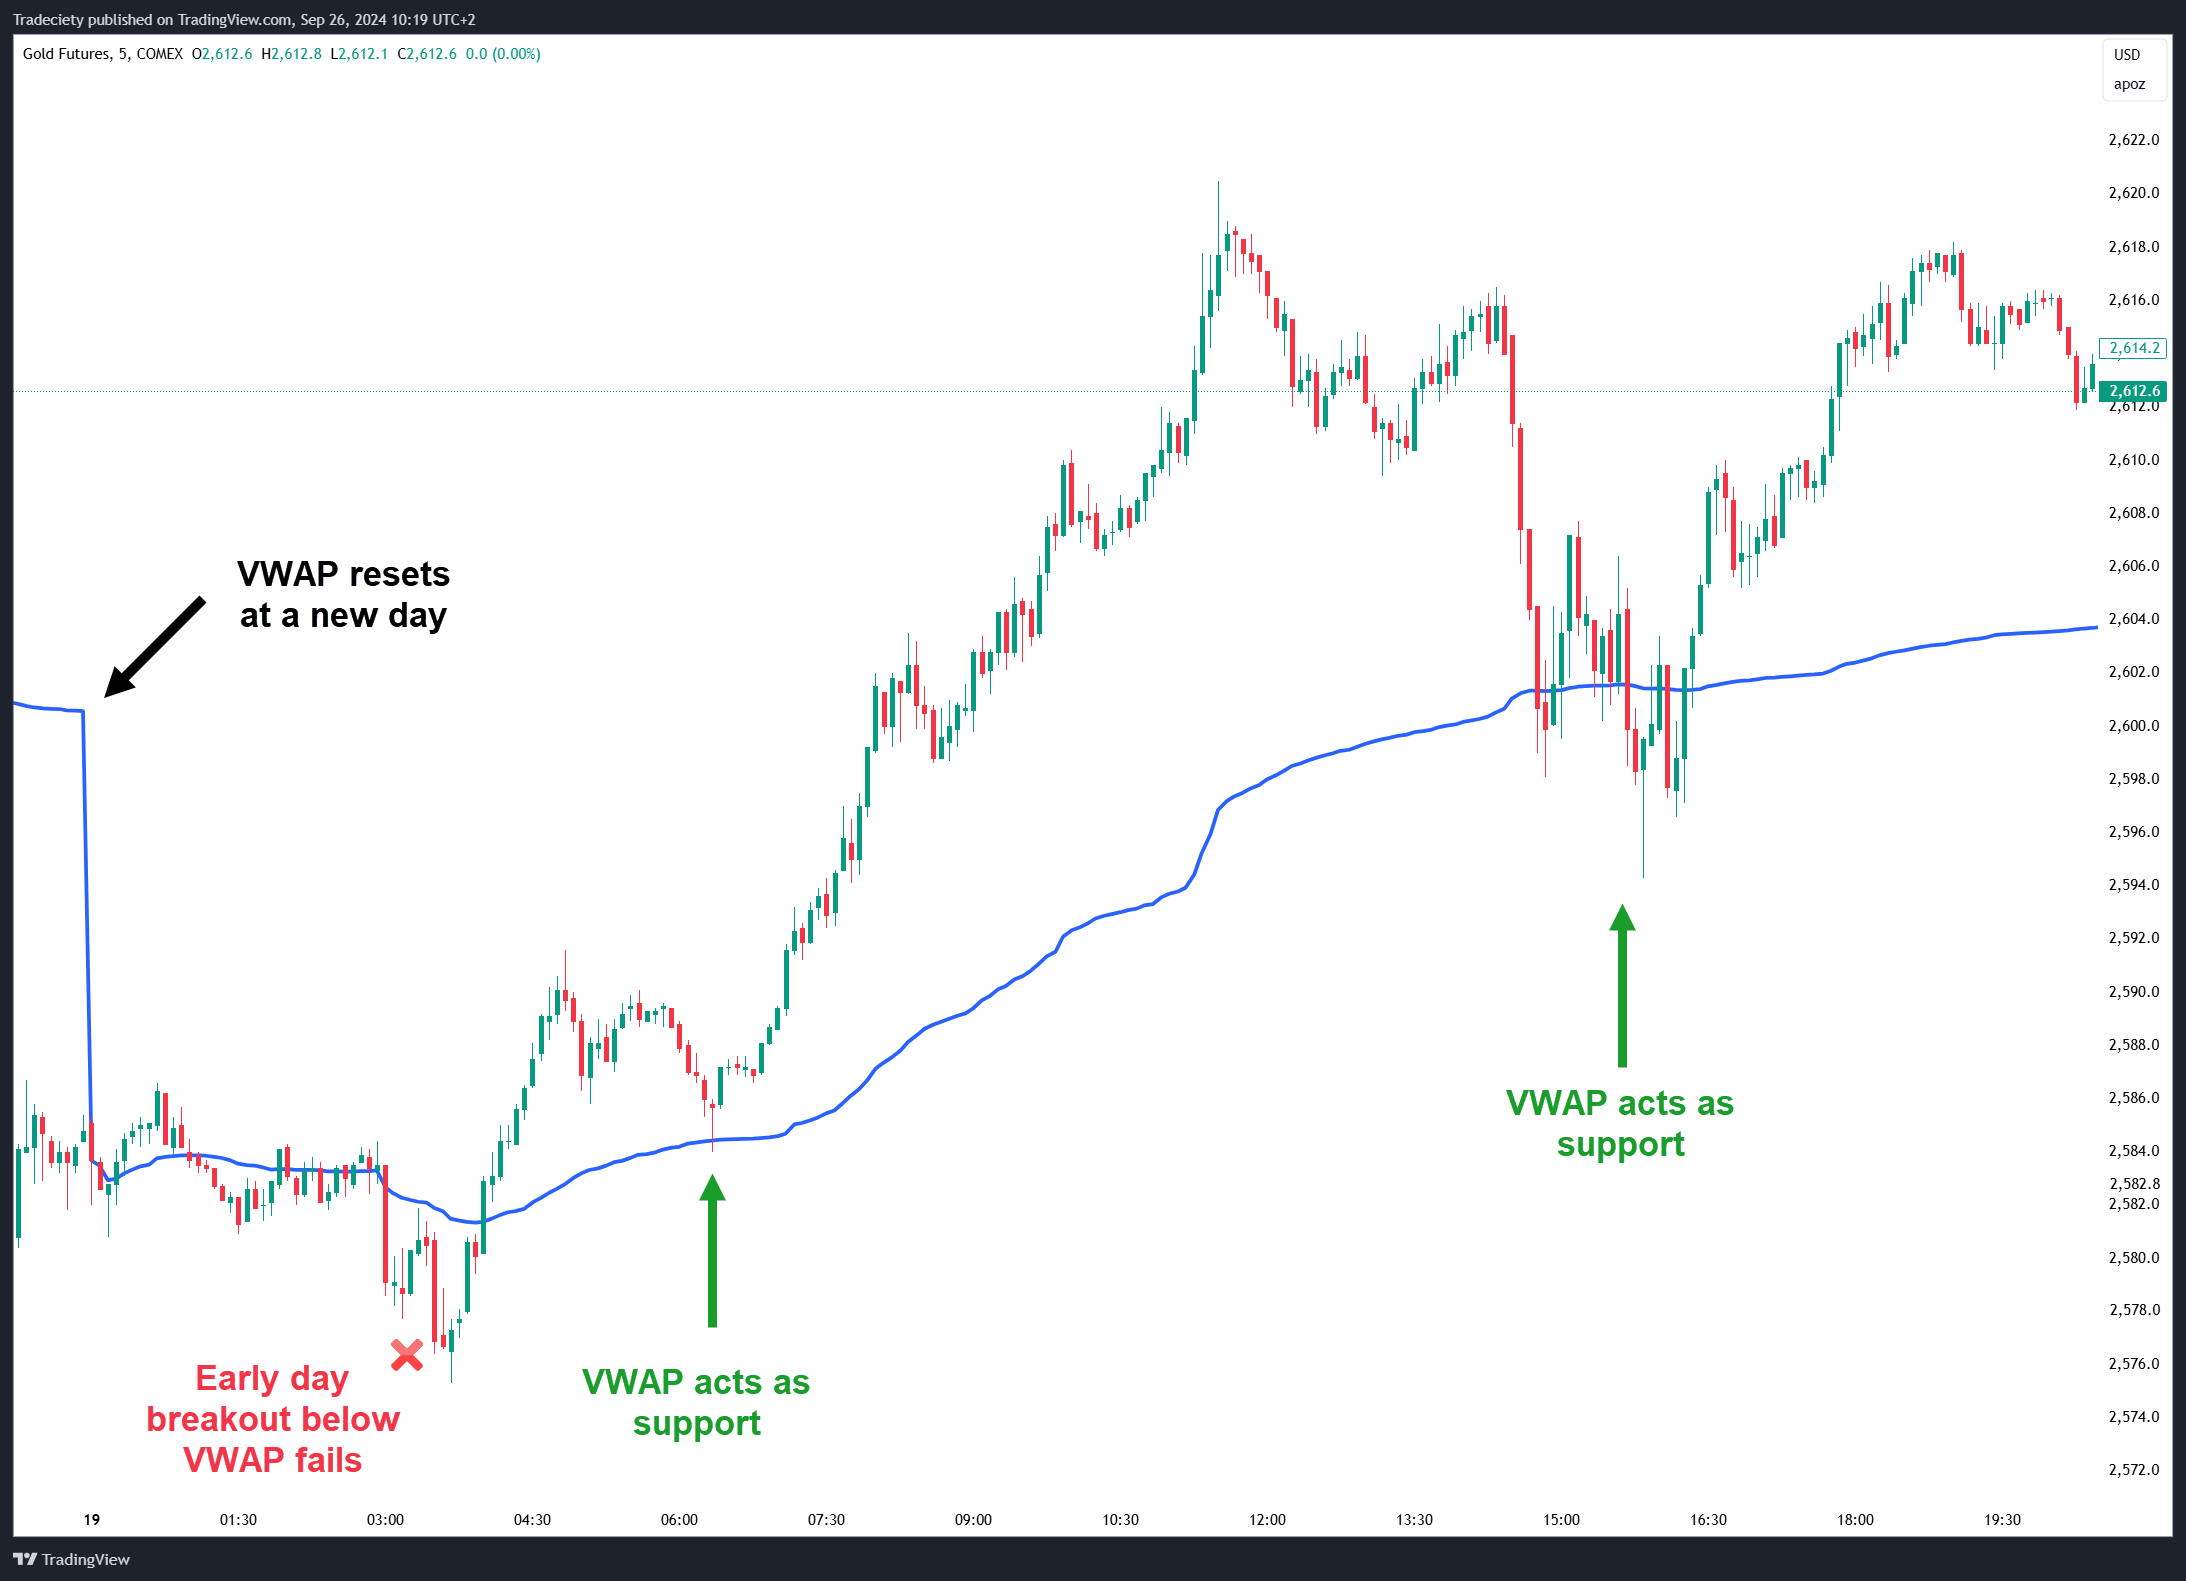
1️⃣ VWAP (Volume Weighted Average Price)


4
VWAP stands for Volume Weighted Average Price. It shows the average price based on both price and volume during the day.
Institutions use VWAP. That alone should get your attention.
Why It’s Powerful:
- Shows intraday fair value
- Acts as dynamic support and resistance
- Helps identify trend direction
How Day Traders Use It:
- Price above VWAP → bullish bias
- Price below VWAP → bearish bias
- Pullbacks to VWAP → potential entry
VWAP works best for stock and crypto intraday trading.
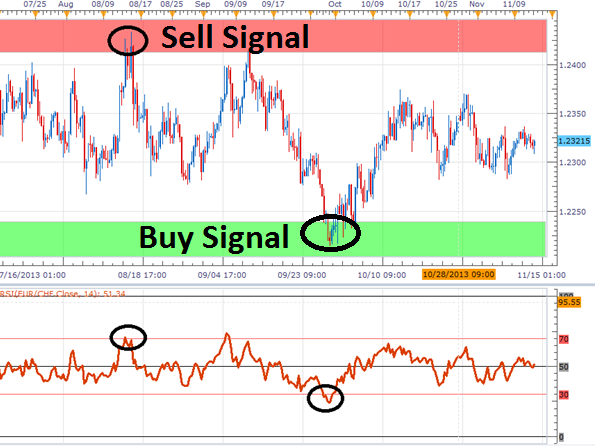
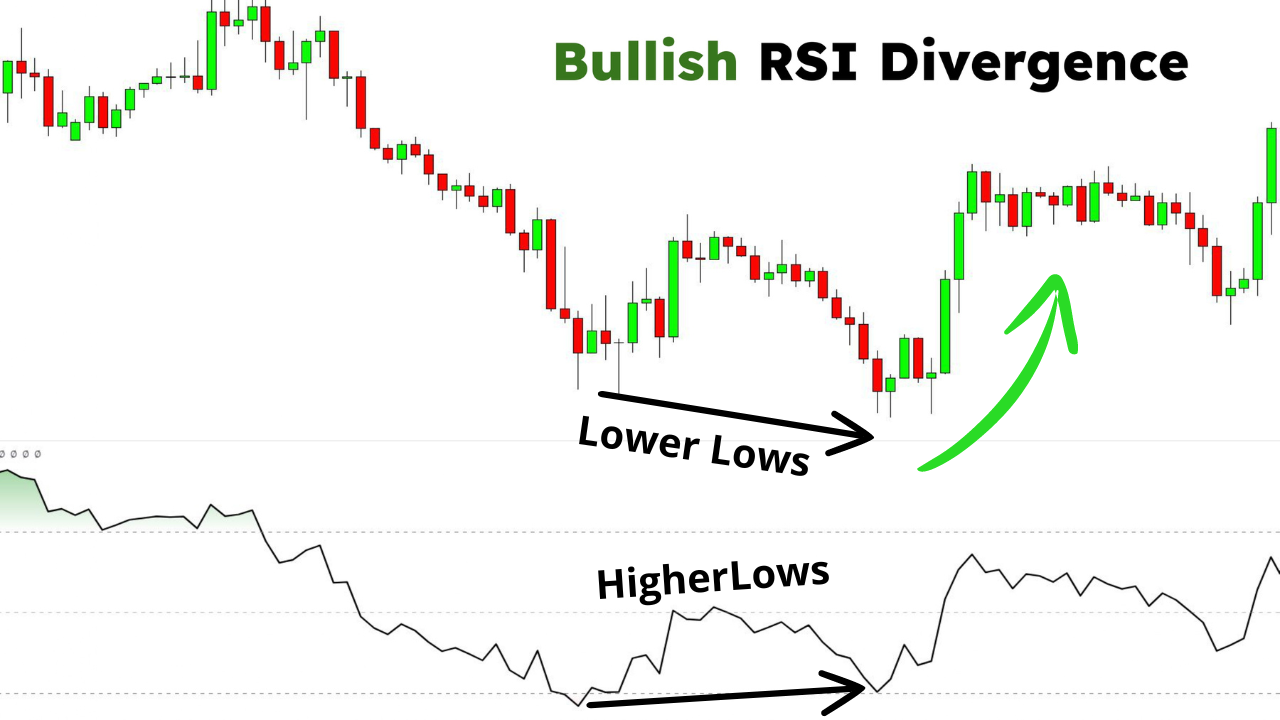
2️⃣ RSI (Relative Strength Index)

4
RSI measures momentum. It tells you if price is overbought or oversold.
Default Settings:
- 14 period
- 70 = overbought
- 30 = oversold
But here’s the nuance most traders miss.
RSI in a strong trend can stay overbought for a long time. Selling just because RSI hits 70 is a rookie mistake.
Better Strategy:
Use RSI for:
- Divergence
- Trend confirmation
- Pullback timing
RSI divergence (price making higher highs while RSI makes lower highs) is especially powerful.
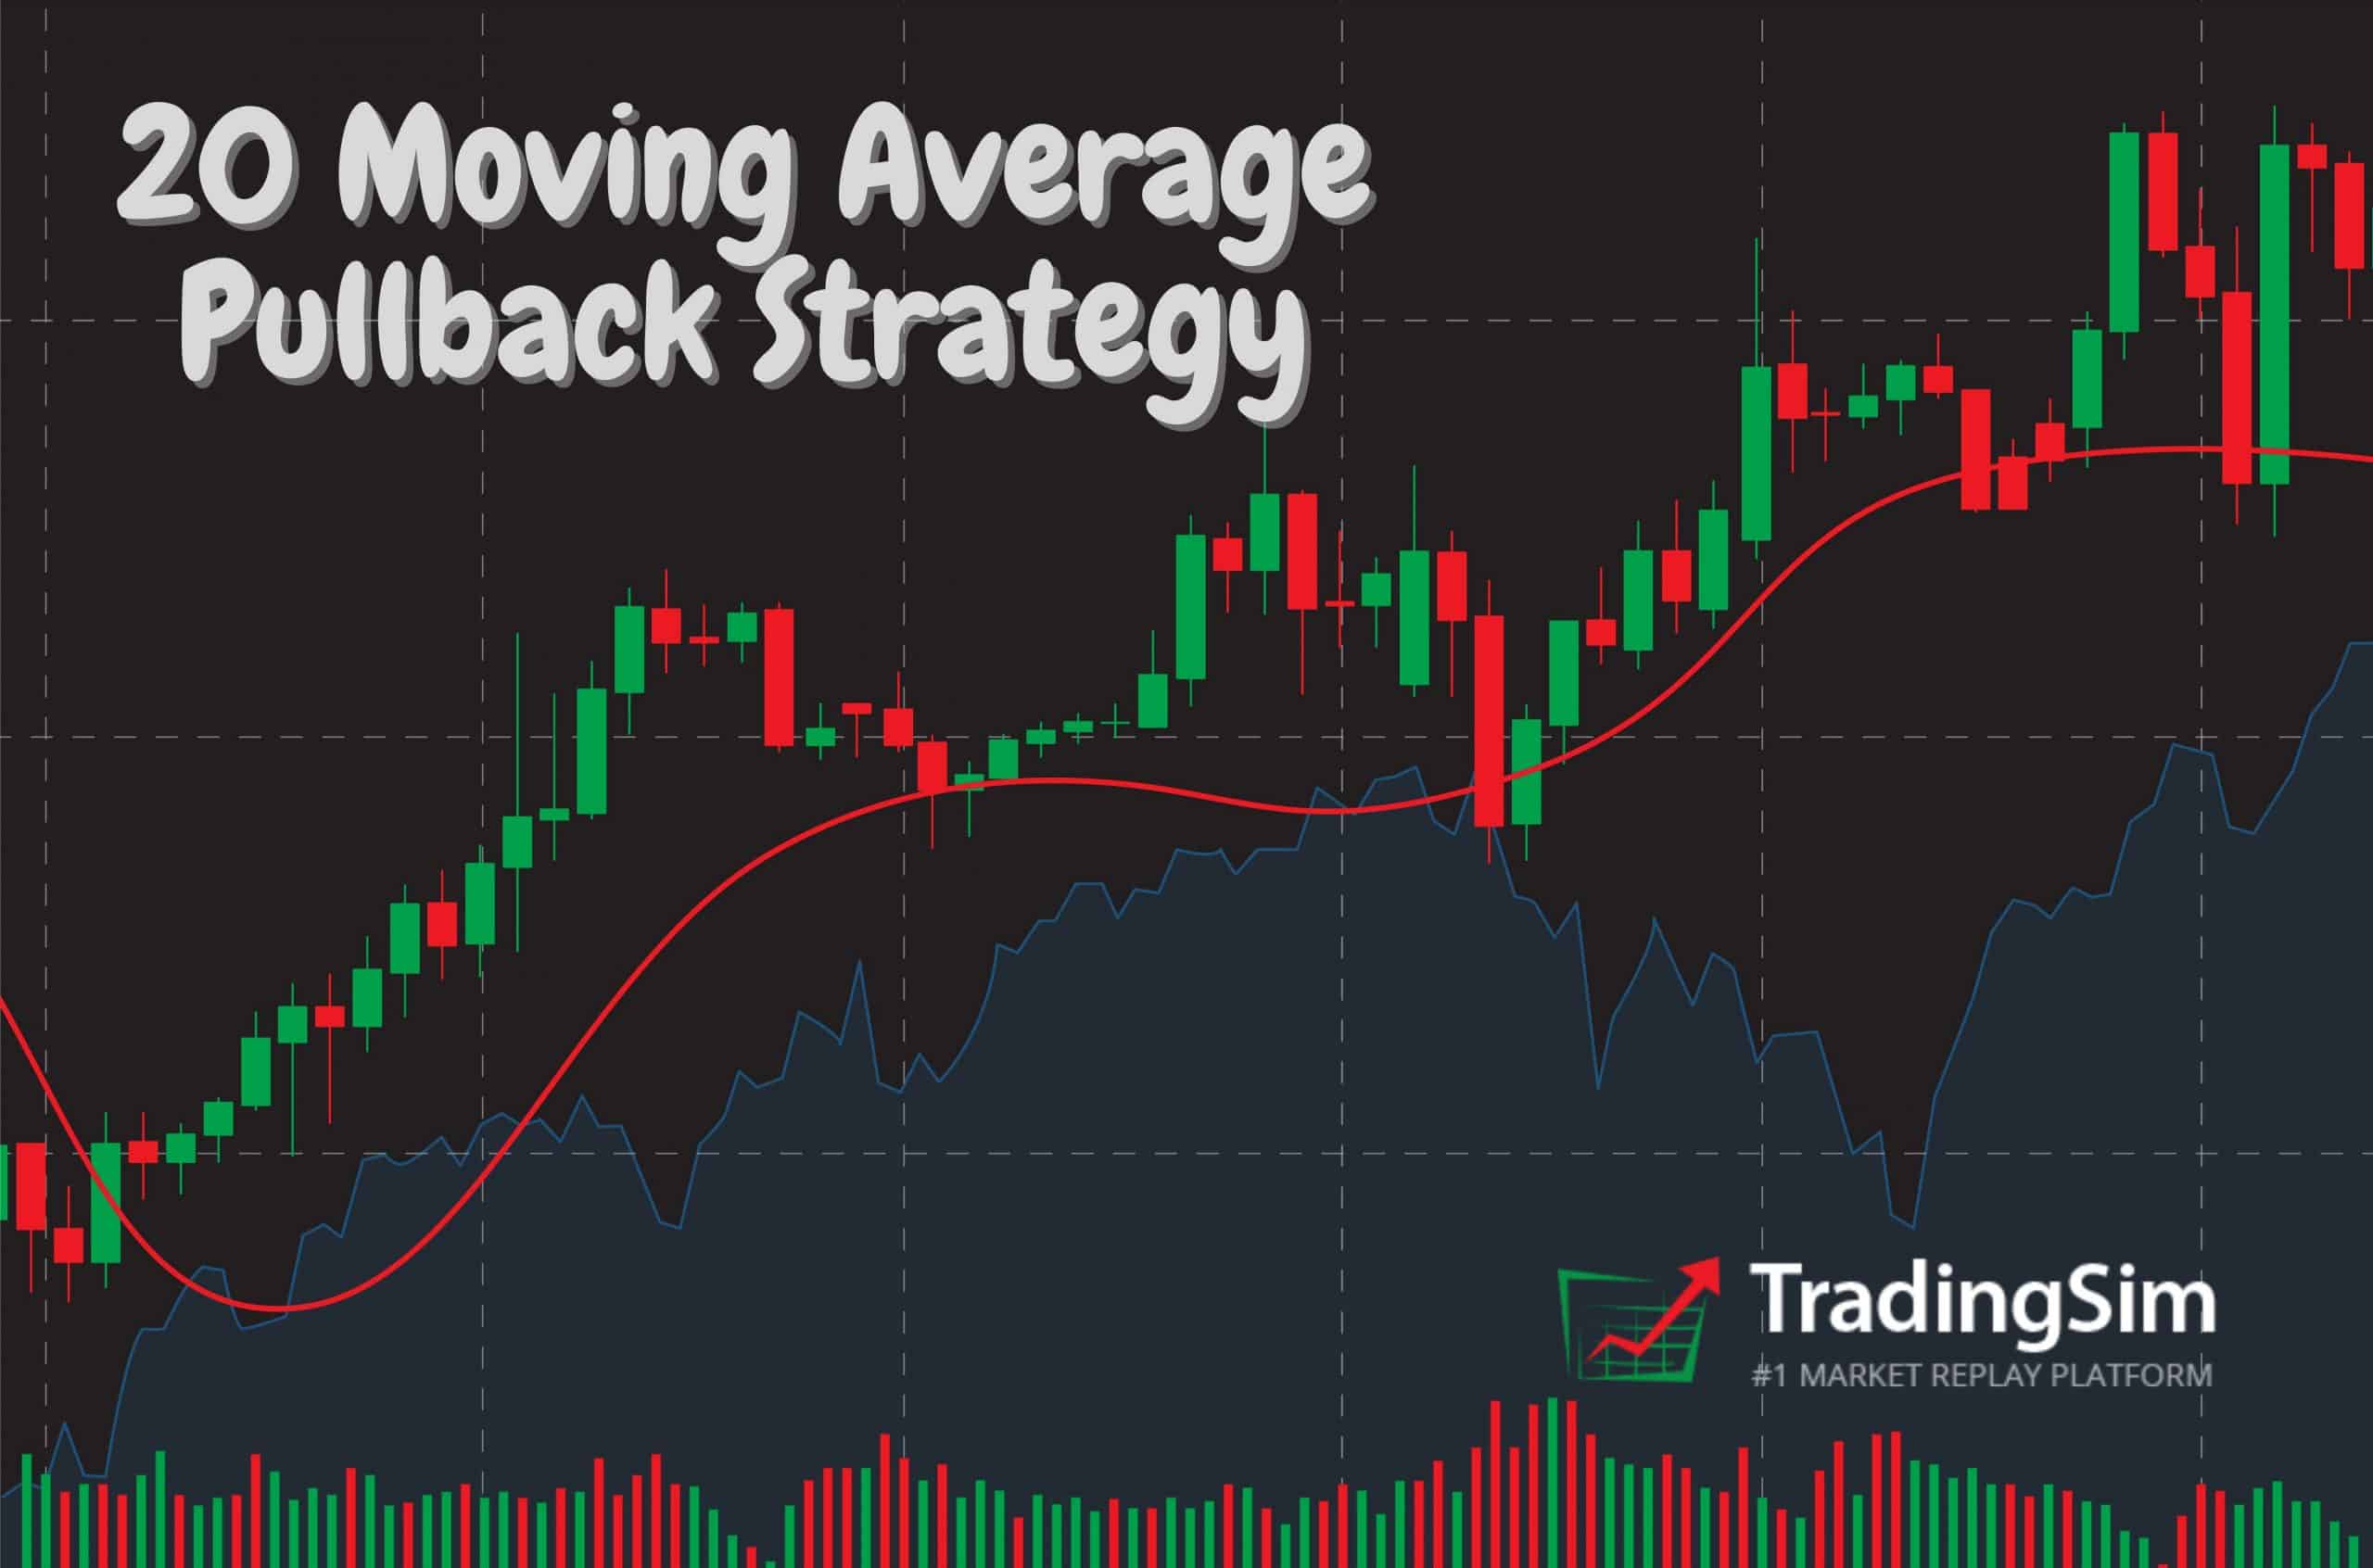
3️⃣ EMA (Exponential Moving Average)


4
EMA reacts faster than simple moving averages.
Most day traders use:
- 9 EMA
- 20 EMA
- 50 EMA
Why EMAs Work:
They help define trend structure.
Common Strategy:
9 EMA crossing above 21 EMA → bullish signal
9 EMA crossing below 21 EMA → bearish signal
Even better: wait for pullback to EMA in trending markets.
Moving averages are not magic. They work because thousands of traders watch them.
Markets are part psychology experiment, part auction system.
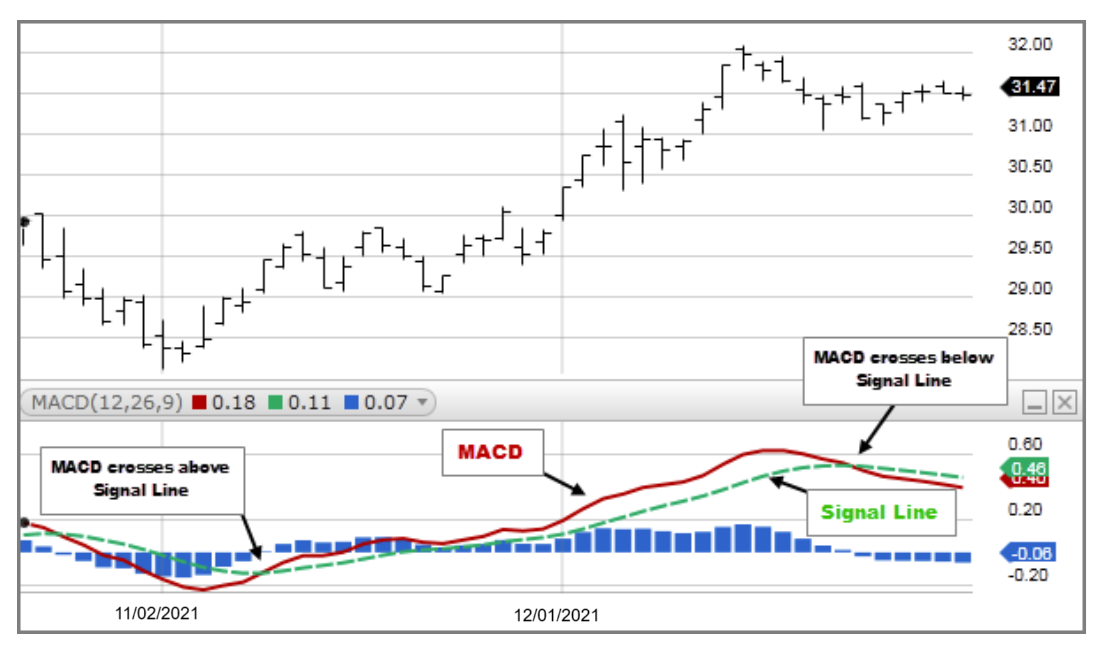
4️⃣ MACD (Moving Average Convergence Divergence)


4
MACD shows momentum shifts.
It consists of:
- MACD line
- Signal line
- Histogram
Best Use for Day Trading:
- Momentum confirmation
- Divergence spotting
- Trend continuation
Avoid using MACD alone. Combine it with structure and volume.
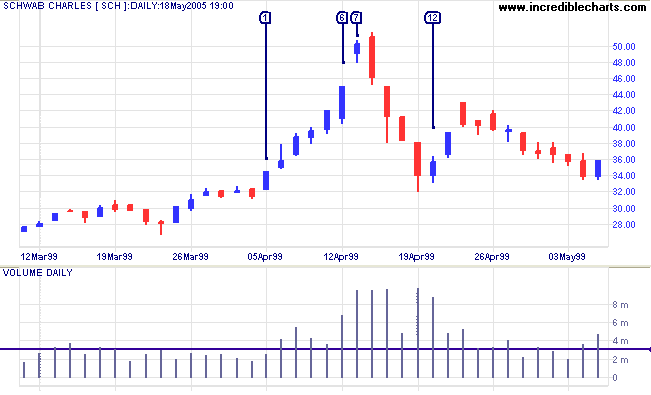
5️⃣ Volume Indicator
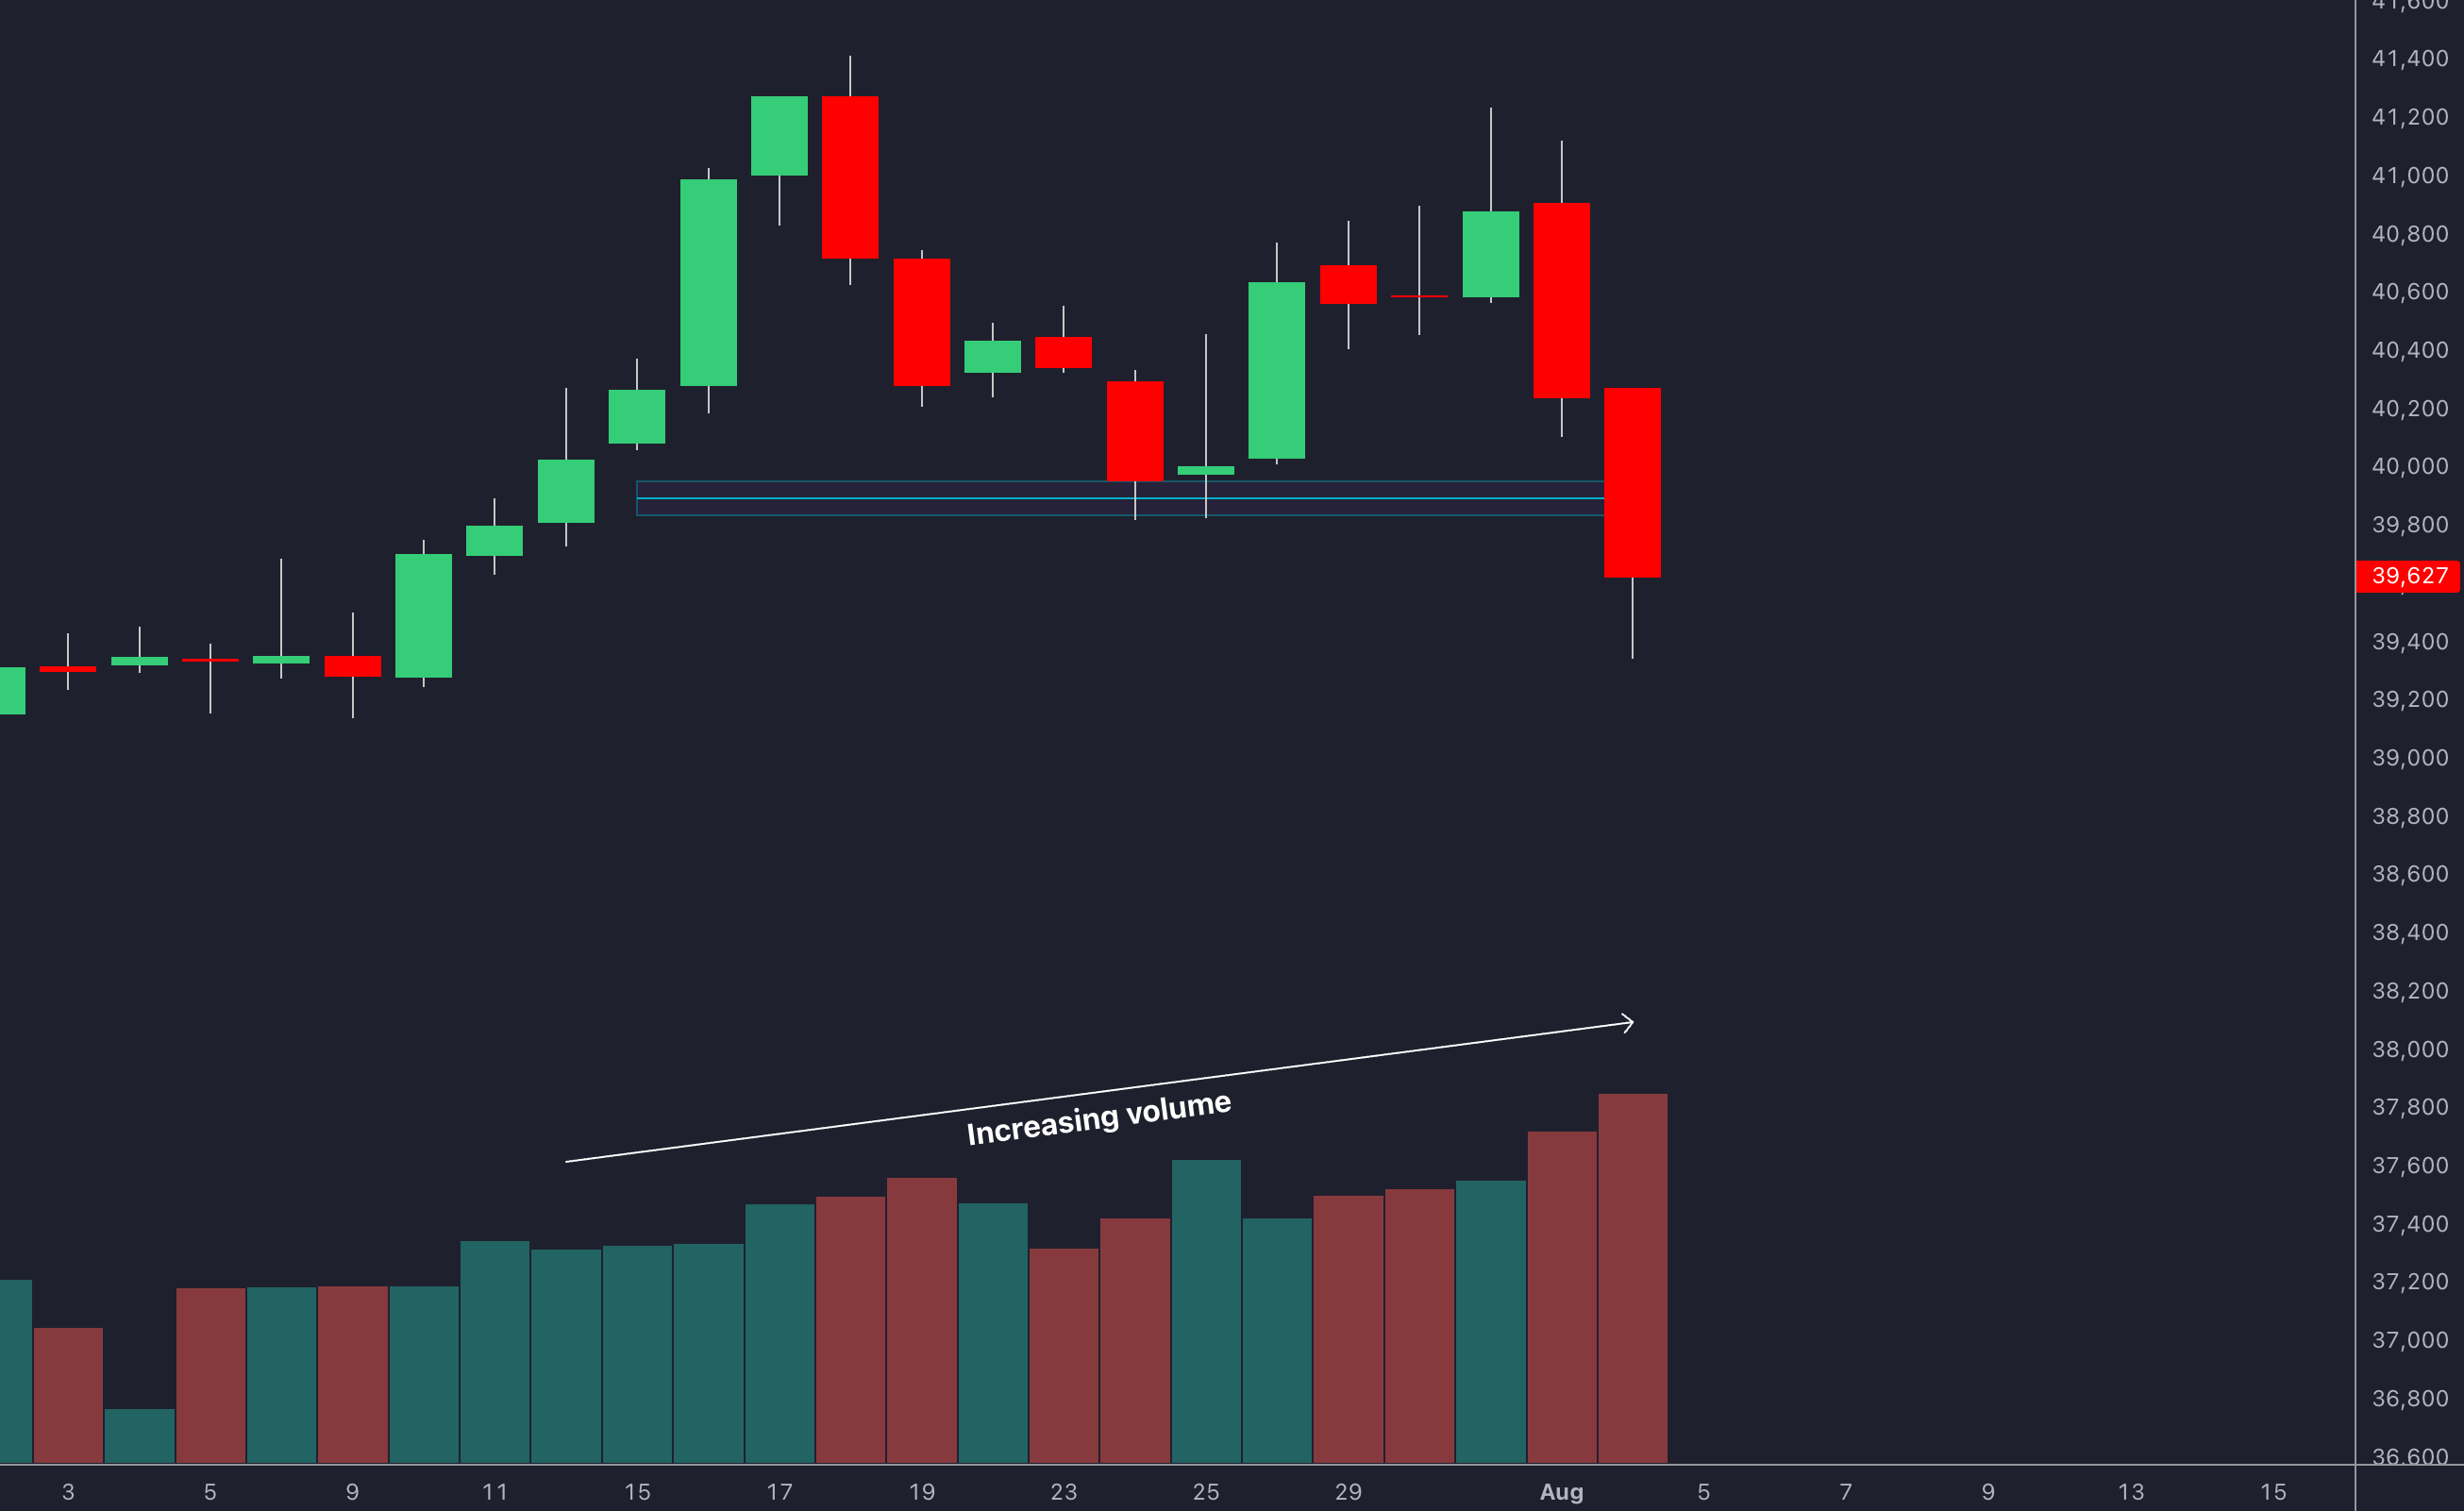
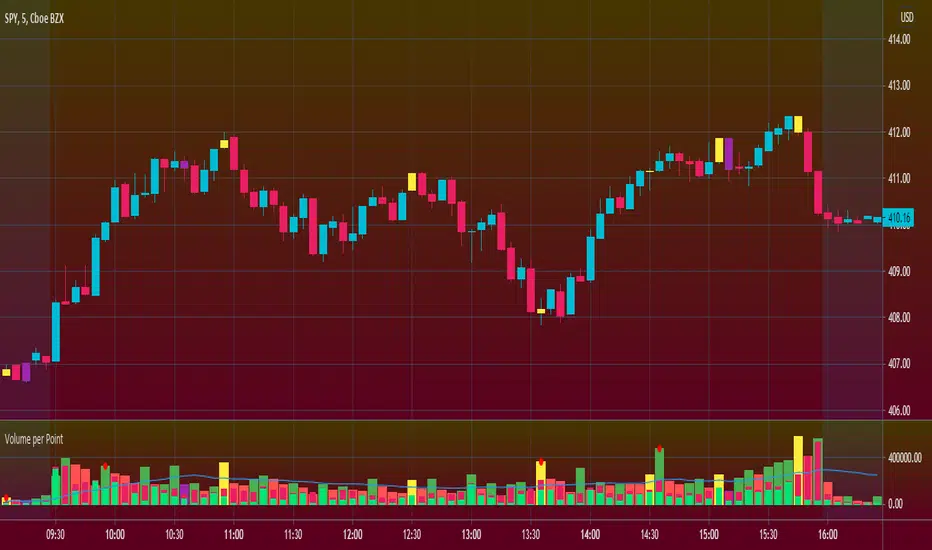
4
Price moves. Volume confirms.
If price breaks resistance without volume, be suspicious.
High volume breakout = stronger move
Low volume breakout = possible fake move
Volume is simple — but incredibly powerful.
6️⃣ Bollinger Bands


4
Bollinger Bands measure volatility.
When bands squeeze → volatility contraction
When bands expand → volatility expansion
Day traders use:
- Band squeezes for breakout setups
- Upper/lower band touches in ranging markets
Do not use Bollinger Bands in strong trending markets without confirmation.
7️⃣ Supertrend Indicator

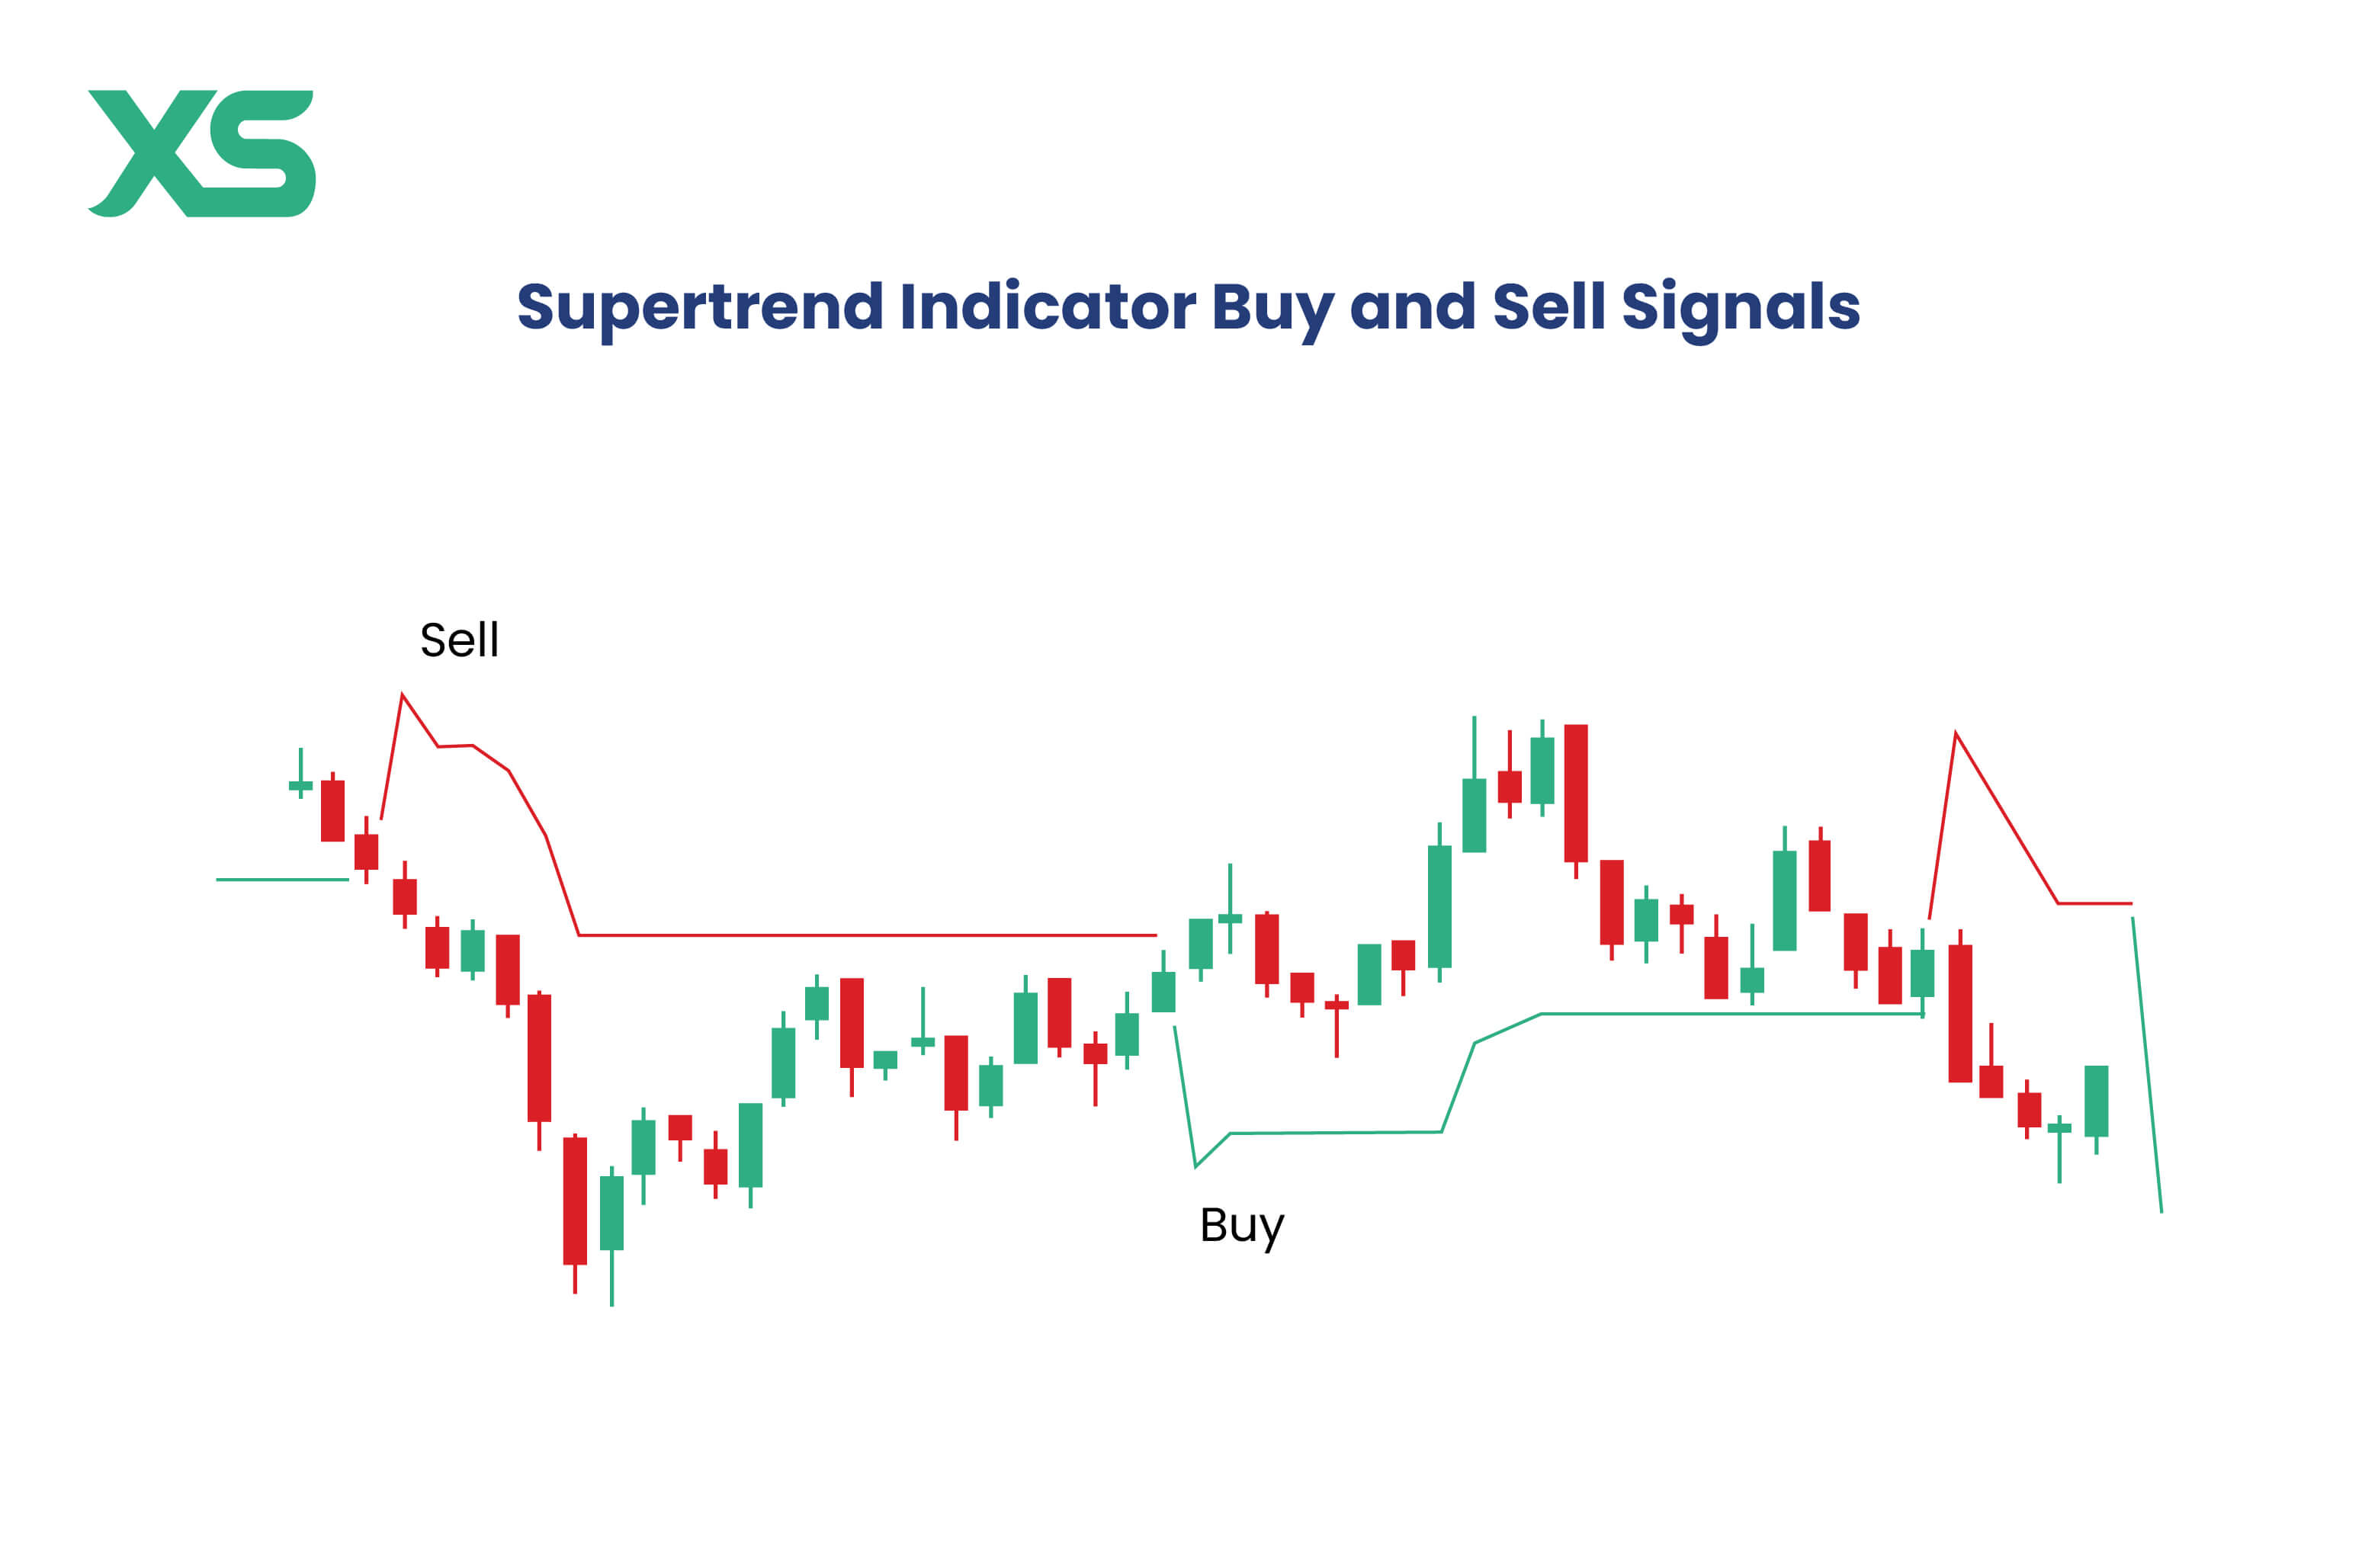
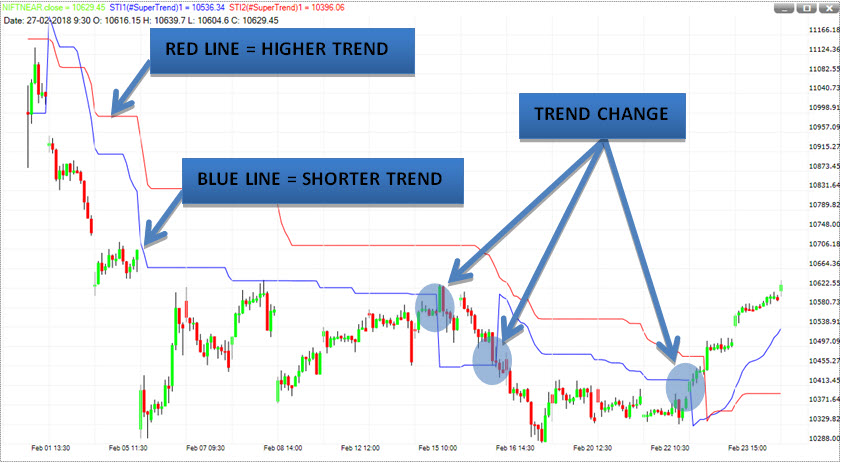
4
Supertrend is popular in 2026 because it visually shows buy/sell zones.
It works well in:
- Trending markets
- Scalping strategies
But like all indicators, it lags price.
Indicators follow price. They don’t predict it.
🔥 Best Indicator Combinations for Day Trading
Instead of stacking everything, try:
Strategy 1:
VWAP + Volume
Institutional-style intraday trading.
Strategy 2:
9 EMA + 21 EMA + RSI
Momentum-based pullback entries.
Strategy 3:
Bollinger Bands + Volume
Volatility breakout strategy.
Keep it simple. Clarity beats clutter.
⚠ The Big Truth About Indicators
Indicators are derived from price.
They are mathematical transformations of past data.
That means:
They lag.
They help with probability — not certainty.
A disciplined trader with one good setup beats a chaotic trader with 12 indicators.
🛡 Risk Management Matters More
You can have the best indicators in the world.
Without:
- Stop loss
- Position sizing
- Risk-reward ratio
- Emotional discipline
You will eventually lose.
Professional traders focus more on risk than on signals.
🧠 Final Thoughts
The best TradingView indicators for day trading in 2026 are:
- VWAP
- RSI
- EMA
- MACD
- Volume
- Bollinger Bands
- Supertrend
But the real edge is not the indicator.
It’s how you manage risk and execute consistently.
Markets are probabilistic systems. They reward discipline and punish ego.
Master one setup. Backtest it. Control risk. Repeat.
That’s how small accounts survive — and grow.
⚠ Disclaimer
Trading involves significant financial risk. This article is for educational purposes only and does not constitute financial advice. Always conduct your own research before trading.
If you want next, I can:
- Create a thumbnail image with bold YouTube-style text
- Write an affiliate-optimized TradingView review
- Build a complete 3-indicator strategy with entry/exit rules
- Create internal linking structure for SEO boost
Trading is not about being right. It’s about managing being wrong.